.png)
Data Science is the combination of Statistics, Machine Learning and Data Analysis.When we have a large number of data we need to do analysis on it and then make a decision to get the proper and accurate data.
Data Science is more driven towards the field of big data which seeks to provide insight information from a large amount of complex data.
It uses various tools, techniques, and various other principles to categorize a huge number of data into the proper set of models.
Data Science Life Cycle:
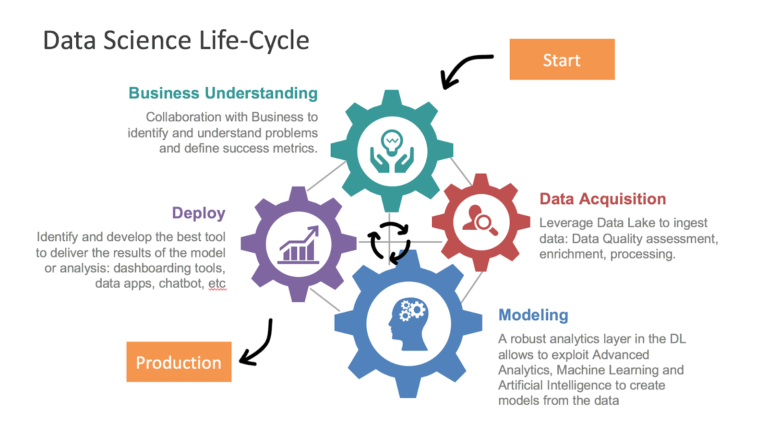
1)Data Discovery and Business Understanding
Initially, we have to understand the business problems and we have to gather different types of data that can be structured and unstructured.
2) Data Acquisition/Data Preparation
We need to leverage or convert a data into the common format.
3) Modeling/Mathematical Models
In this by using variables and equations to build a relationship and accurate result.In this Statistics plays an important role.
4) Deploy
The correct and accurate data can be deployed.
Data Science Components:
1)Data
The raw data that is obtained by filtering the data that is not raw data which is useful and it is the part of the Data Science
The data can be of 2 types:
1)Structured
The structured data is in the tabular form
2)Unstructured
The data such as images, videos, pdf, etc are unstructured data
2)Programming(Python and R)
To manage and analyze the data the programming languages such as Python and R are used in data science.
3)Statistics
This is a very powerful tool of the data and with the help of mathematics, we can perform and get the raw data that is useful.
What is Statistics and how it plays an important role?
Statistics can be defined as a methodology to perform data collection, analysis, interpretation, and presentation.
It is a mathematical science and applies the various statistical methods or algorithms on a set of data to determine the values which can be solved in real life.
To solve the real problems in various industry tools statistics uses various methods such as frequency analysis, mean, median, mode, variance analysis, correlation, regression, etc and also it focuses on analysis using standard techniques involving mathematical formulas and methods.
Data Science is more driven towards the field of big data which seeks to provide insight information from a large amount of complex data.
It uses various tools, techniques, and various other principles to categorize a huge number of data into the proper set of models.
Data Science Life Cycle:
1)Data Discovery and Business Understanding
Initially, we have to understand the business problems and we have to gather different types of data that can be structured and unstructured.
2) Data Acquisition/Data Preparation
We need to leverage or convert a data into the common format.
3) Modeling/Mathematical Models
In this by using variables and equations to build a relationship and accurate result.In this Statistics plays an important role.
4) Deploy
The correct and accurate data can be deployed.
Data Science Components:
1)Data
The raw data that is obtained by filtering the data that is not raw data which is useful and it is the part of the Data Science
The data can be of 2 types:
1)Structured
The structured data is in the tabular form
2)Unstructured
The data such as images, videos, pdf, etc are unstructured data
2)Programming(Python and R)
To manage and analyze the data the programming languages such as Python and R are used in data science.
3)Statistics
This is a very powerful tool of the data and with the help of mathematics, we can perform and get the raw data that is useful.
What is Statistics and how it plays an important role?
Statistics can be defined as a methodology to perform data collection, analysis, interpretation, and presentation.
It is a mathematical science and applies the various statistical methods or algorithms on a set of data to determine the values which can be solved in real life.
To solve the real problems in various industry tools statistics uses various methods such as frequency analysis, mean, median, mode, variance analysis, correlation, regression, etc and also it focuses on analysis using standard techniques involving mathematical formulas and methods.
How Statistical analysis plays an important role:
In simple words, Statistics can be used to derive meaningful insights from data by performing mathematical computations on it. To become a successful Data Scientist Statistics must be powerful.
Application Areas Used:
Terminologies in Statistics – Statistics for Data Science
To deal with the statistics one must be aware of the terminologies. So let’s have a look into the few and important key statistical terminologies stated below:
1)Population
It is a set of sources from which data has to be collected.
2)Sample
It is a subset of the Population
3)Variable
Any Characteristics, number or quantity that can be counted or measured.
4)Statistical Parameter
It is a quantity that indexes a family of probability distributions. For examples mean, median, mode, etc
Types of Analysis:
–Two types of analysis:
1)Quantitative
2)Qualitative
For example, I want to purchase a burger meal from McDonald’s, it is available in small, medium and large. This is an example of Qualitative Analysis.
But if McDonald’s stores sell 50 regular burger large meals in a week, it is Quantitative Analysis.
Categories in Statistics There are mainly 2 Categories in Statistics:
1)Descriptive Statistics
2)Inferential Statistics
Descriptive Statistics: –It uses the data to get the descriptions of the population from the numerical, graph and tabular form. -When we try to represent data in the form of graphs, lines, histograms, etc the data is represented based on the central tendency. Central tendency measures like, mean, median, or measures of the spread, etc are used for statistical analysis.
Mean: The mean is equal to the sum of all the values in the data set divided by the number of values in the data set i.e the calculated average.
Median: If a series or set of values are arranged in ascending (descending) order of magnitudes then the middlemost value is called the median of the series.
Mode: A mode is defined as the value of the variable which occurred most frequently in the set of observations.
2)Inferential Statistics:
It makes inferences and predictions about a population based on a sample of data taken from the population in question.
Madrid Software Trainings provides huge opportunities to learn Data Science Courses in Delhi helping you to establish a career in Data Scientist by learning all the techniques and growing in terms of knowledge and shaping the future in the right manner.
The Data Science Courses in Delhi offers a wide range of courses and is very highly qualified to step ahead of your career and also provides end to end knowledge theoretically as well as practically.
So, the role of Data Scientist is very important in any industry in order to leverage their business in a correct manner.
- Present key findings revealed by a dataset.
- It summarizes information.
- It calculates the measurement of data by mathematical methods.
- Make future predictions based on previously recorded data.
- It also tests experimental predictions.
In simple words, Statistics can be used to derive meaningful insights from data by performing mathematical computations on it. To become a successful Data Scientist Statistics must be powerful.
Application Areas Used:
- Stock markets, commerce, and trade
- Retail, education, and Insurance
- Psychology and Astronomy
- Life Science and Weather
Terminologies in Statistics – Statistics for Data Science
To deal with the statistics one must be aware of the terminologies. So let’s have a look into the few and important key statistical terminologies stated below:
1)Population
It is a set of sources from which data has to be collected.
2)Sample
It is a subset of the Population
3)Variable
Any Characteristics, number or quantity that can be counted or measured.
4)Statistical Parameter
It is a quantity that indexes a family of probability distributions. For examples mean, median, mode, etc
Types of Analysis:
–Two types of analysis:
1)Quantitative
2)Qualitative
| Quantitative | Qualitative |
|---|---|
| In this type of analysis, collecting and interpreting data in the numbers and charts, graphs, etc in order to identify the pattern. | In this type of analysis, it gives the user information, text, sound, etc |
For example, I want to purchase a burger meal from McDonald’s, it is available in small, medium and large. This is an example of Qualitative Analysis.
But if McDonald’s stores sell 50 regular burger large meals in a week, it is Quantitative Analysis.
Categories in Statistics There are mainly 2 Categories in Statistics:
1)Descriptive Statistics
2)Inferential Statistics
Descriptive Statistics: –It uses the data to get the descriptions of the population from the numerical, graph and tabular form. -When we try to represent data in the form of graphs, lines, histograms, etc the data is represented based on the central tendency. Central tendency measures like, mean, median, or measures of the spread, etc are used for statistical analysis.
Mean: The mean is equal to the sum of all the values in the data set divided by the number of values in the data set i.e the calculated average.
Median: If a series or set of values are arranged in ascending (descending) order of magnitudes then the middlemost value is called the median of the series.
Mode: A mode is defined as the value of the variable which occurred most frequently in the set of observations.
2)Inferential Statistics:
It makes inferences and predictions about a population based on a sample of data taken from the population in question.
Madrid Software Trainings provides huge opportunities to learn Data Science Courses in Delhi helping you to establish a career in Data Scientist by learning all the techniques and growing in terms of knowledge and shaping the future in the right manner.
The Data Science Courses in Delhi offers a wide range of courses and is very highly qualified to step ahead of your career and also provides end to end knowledge theoretically as well as practically.
So, the role of Data Scientist is very important in any industry in order to leverage their business in a correct manner.

.png)


 (4).png) Call Now
Call Now