Business analytics has become a core skill across industries—helping teams uncover trends, assess risks, and improve
performance through data. This course by Madrid Software
is crafted for individuals looking to develop practical skills
in analytics that translate
directly to business impact.
The curriculum covers key tools such as Excel, SQL, Power BI, Tableau, and statistical
methods used in day-to-day
analysis. Classes are led by experienced professionals who bring real business scenarios into the learning process,
making the content both relevant and immediately applicable.

Training Available
Completed
Years Exp.
Take the first step towards a smarter Future 🚀
We don’t just teach dashboards and data. We prepare you to solve real business problems—
with practical tools, expert
guidance, and outcomes that matter in today’s data-first world.

Get trained in Excel, SQL, Power BI, Tableau, and statistical techniques that are actively used in corporate environments.

Work on real business case studies—from revenue analysis to customer segmentation—designed to reflect what companies expect from analysts.

Every topic is selected with purpose—no filler, just relevant, actionable content that sharpens your decision-making and problem-solving skills.

Complete project-based assignments that demonstrate your ability to analyze data, create dashboards, and present insights clearly to stakeholders.

Choose between classroom sessions or live online classes. All sessions come with recordings, so you can learn at your own pace.

Get help with resume building, analytics interview preparation, and one-on-one career guidance to help you transition smoothly into a business analytics role.
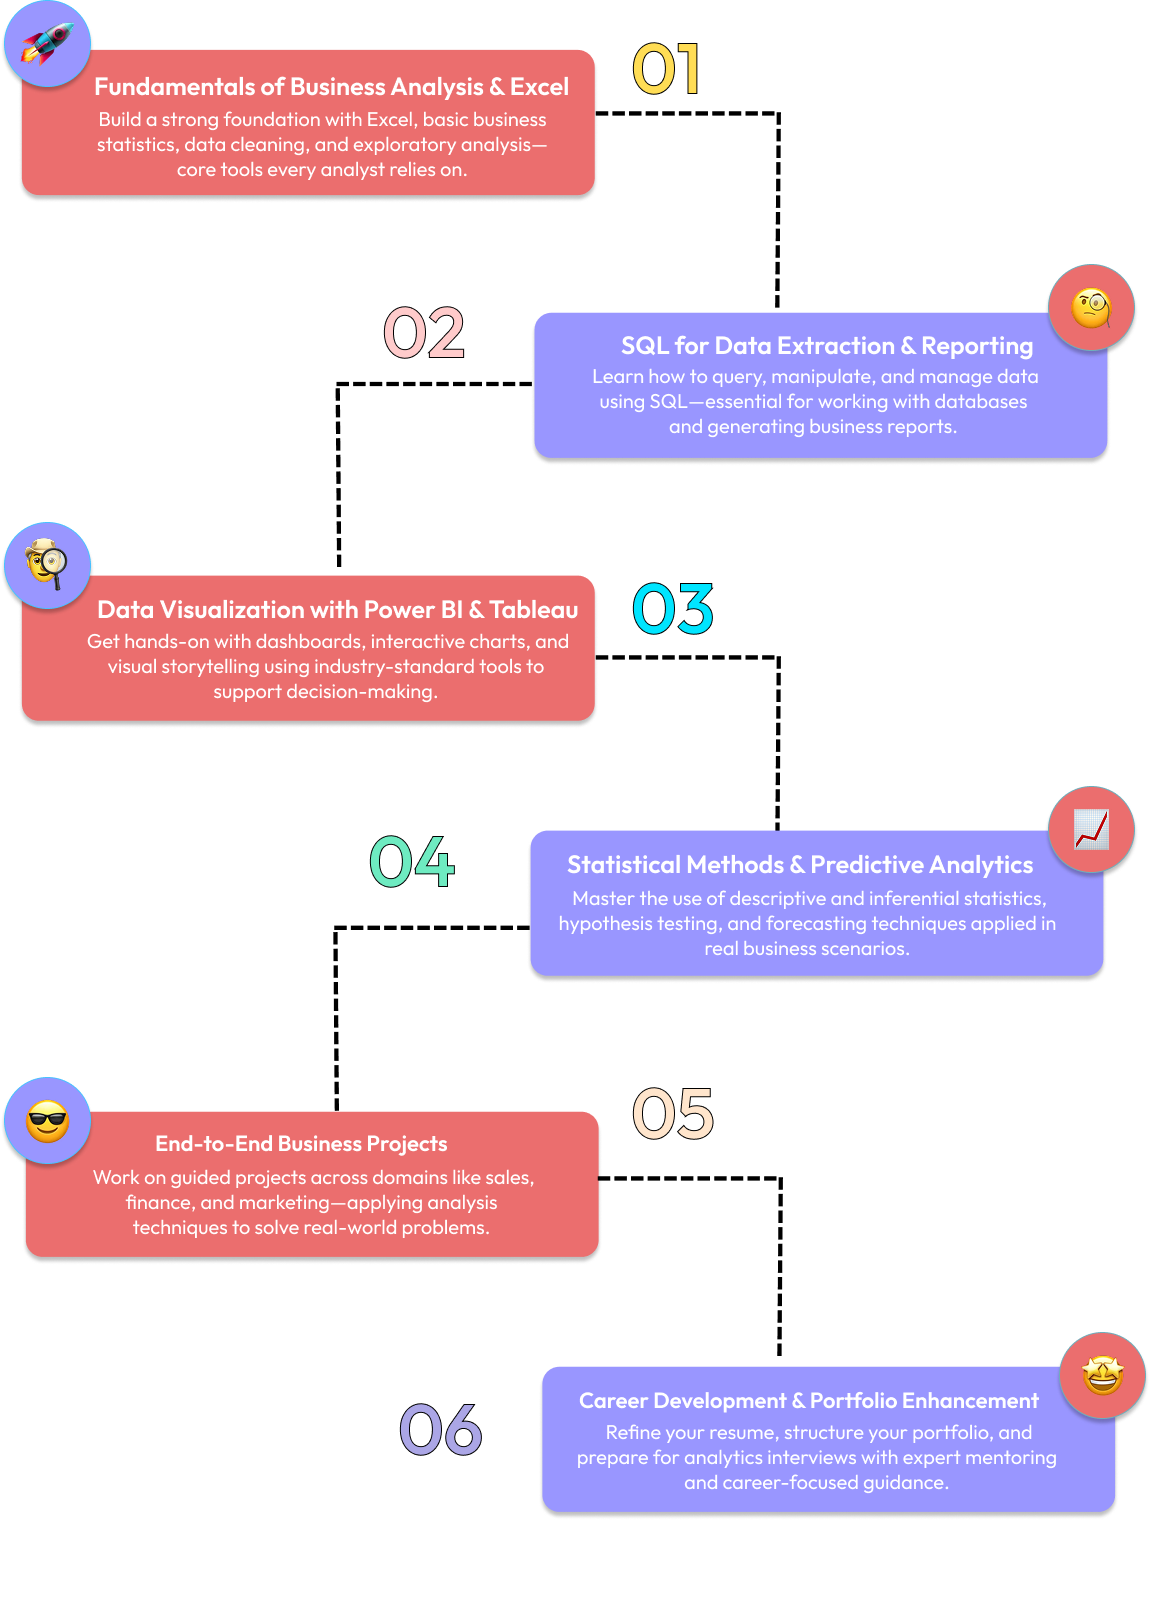
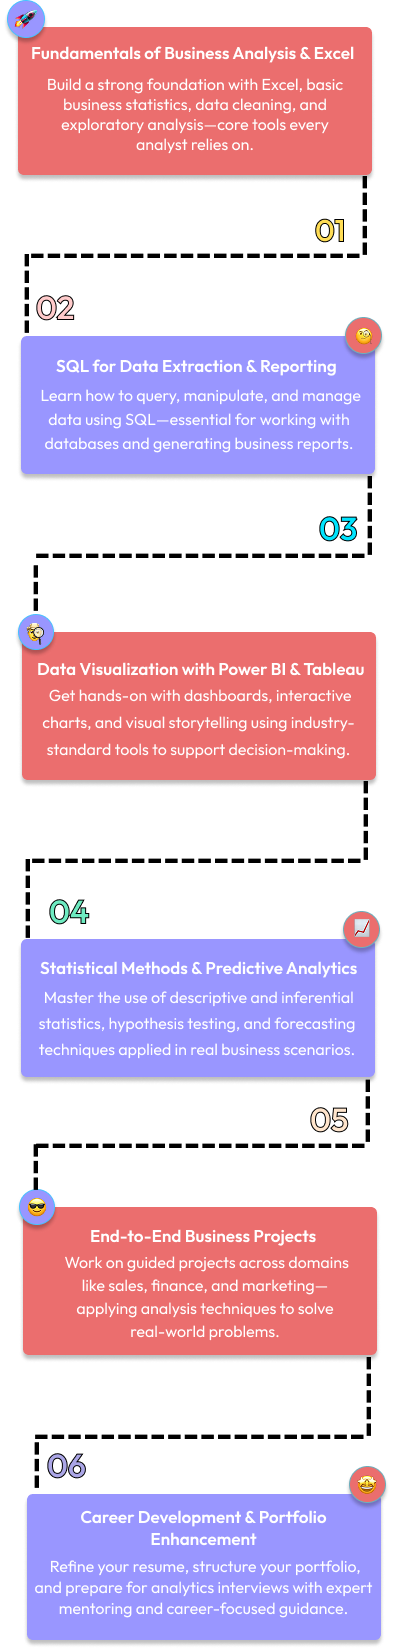
This outcome-driven Business Analytics course is structured to take you from core concepts to
confident, job-ready
skills in just six well-defined phases.
Master the skills top companies look for—data interpretation, analytical thinking, and
communication that supports
strategic decisions.
Your Learning Journey Starts Here 🚀


Analyze historical sales data to identify patterns, seasonal trends, and underperforming regions using Power BI or Tableau.

Use clustering techniques to group customers based on behavior and purchasing patterns to drive marketing strategies.

Build an interactive model that helps businesses optimize product mix and pricing for maximum returns.

Evaluate inventory turnover, lead times, and demand forecasting to reduce operational bottlenecks.


 IBM Certificate
 Placement Support
Industry Certification
Placement Support
Industry Certification
 Hands-on Training
 1.png)
Not sure if this course is for you? If you fall into any of these
categories, you’re the perfect fit

Recent Graduates
& Early-Career
Professionals

Working
Professionals
Seeking Growth
Marketing & Sales
Specialists
Product Managers &
Business Leaders
Take the first step towards a smarter Future 🚀
The Data Speaks for Itself
.png)

Projected global business
analytics market size by 2030

Estimated analytics-related job
openings globally by 2027

Annual growth ratein demand for
analytics professionals
Do I need prior programming experience to join the Business Analytics course?
What certification will I receive after completing the course?
Is there career support provided post-completion?
Are classes available both online and in-person?
How long does the Business Analytics program typically take?
Will I work on practical projects during the course?
Can professionals from non-technical backgrounds join?
What roles can I target after completing this course?